This report pack includes a review of the many reports available in CommunityWFM version 5.x
Organization
This document will review each report in the Report tab, top to bottom, then will review reports located in other areas of the application.
You can run many of the same reports from the Report tab and work areas. For example, run a published forecast staffing requirements report from Report > Published forecast > Staffing requirements, or from Forecast > Published forecast > Generate forecast reports.
Overview of Report Tab
Access many frequently used reports from a central location—the Report tab.
Contact Volume
Use these reports to analyze your data for arrival patterns and forecasting. Analyze by data source or an activity in the Enterprise Model.
Enterprise model
Use the Chart Display Options in the Show options panel then select filters to access different views.
Date Charts Only – Executive Summary.
Filters (there are different filters based on selected chart display)
Total contact volume by—
- Date
- Interval
- Day of Week
- Week
- Month
- Site, Folder, or Activity
- Media type
Average contact volume by—
- Interval
- Day of Week
- Month
- Site, Folder, or Activity
- Media type
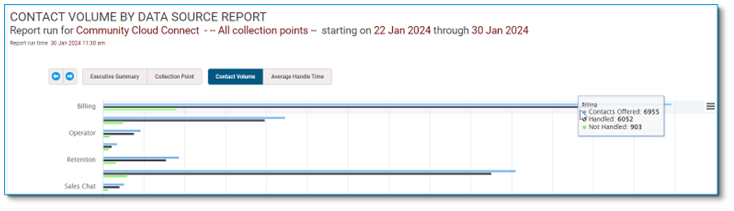
Data source
This report shows trends and provides data for analysis of your arrival patterns. Includes contact volume and average handle time from one or all collection points or imported from an Excel worksheet. Use the Chart Display Options in the Show options panel to access the different views.
Total contact volume by--
- Date
- Interval
- Day of Week
- Week
- Month
- Collection Point
Average contact volume by—
- Interval
- Day of Week
- Month
- Collection Point
View totals or averages, by date, interval, day of week, collection point, from executive summary to details.
 Published forecast
Contact volume & handle time
View your forecast with historical contact volume data and analyze your forecast accuracy.
Total Forecast Contacts by—
- Date
- Interval
- Day of Week
- Week
- Month
- Activity Type
- Media Type
Average Forecast Contacts by—
- Interval
- Day of Week
- Month
Service targets / Shrinkage percentages
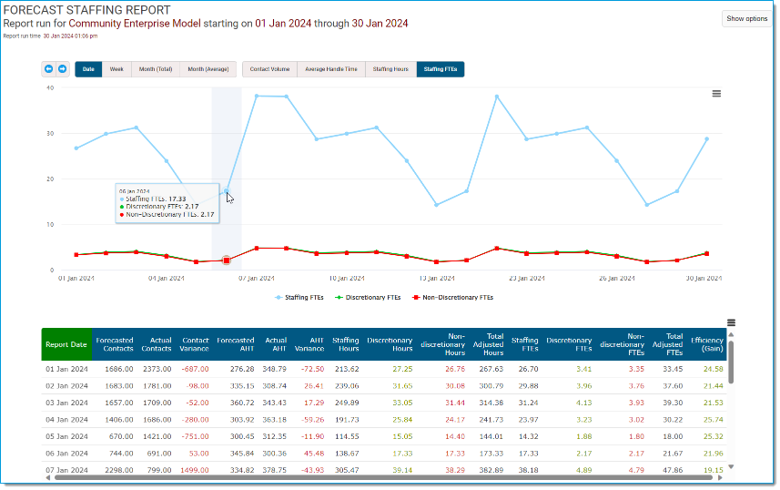
Staffing requirements
This includes forecasted requirements based on contact volume, handle time, service target, and shrinkage.
Enter a date range to see historical data by:
- Date
- Week
- Month (Total)
- Month (Average)
Use Show options to select:
- Date Charts Only
- Interval Charts Only (detail, total, average)
- Days Charts Only (total, average)
- Misc Charts Only (activity, media type)
Date Charts Only view
 Published schedule
Use the published schedule reports to see published schedules for a date range and activity. At the Enterprise Model level you can see your daily coverage by day and interval to see if you have enough staff to meet your service level, and even launch automated schedule adjustment plans (ASAPs). At all levels you can make edits to the published schedule).
Schedule details
View schedules for the Enterprise Model, a supervisor tree, or a custom user group.
Use the Options panel to select the date range and sorting type, with options to suppress or show agents with no schedule, include the event name in the interval display, and whether to enable notifications if you make changes to the published schedule.
Use the Enterprise Model view to see the staffing requirements net-line statistics. Because forecasts are made at the activity level, the supervisor and custom user group views do not display the net-line statistics.
Schedule analysis
Schedule analysis includes four options:
1. Schedule analysis details
Filter for executive summary, contact volume, AHT, staffing, or service estimate. View data for each day in 15-minute intervals.
2. Schedule analysis weekly view
View a table with staffing requirements information in 15-minute intervals and columns for each day. This report is helpful for viewing a full week in one view.
3. Full service metric summary
View details for the week and totals for the individual days.
Check the box to include leaf node activity results.
4. Compact service metric summary
View totals for the week and each day.
Report options include a checkbox to view by leaf node activity.
Schedule summary (printer)
Returns a summary of schedules for the schedule week in a printer-friendly format. Includes the option to include off-site events. The report opens in a new browser window – ready for printing or exporting to .csv or .xlsx.
Schedule details (printer)
Select an activity and start date, then select whether to include off-site events (such as PTO). Returns details of schedules for the schedule week sorted by agent in a printer-friendly format. The report opens in a new browser window – ready for printing.
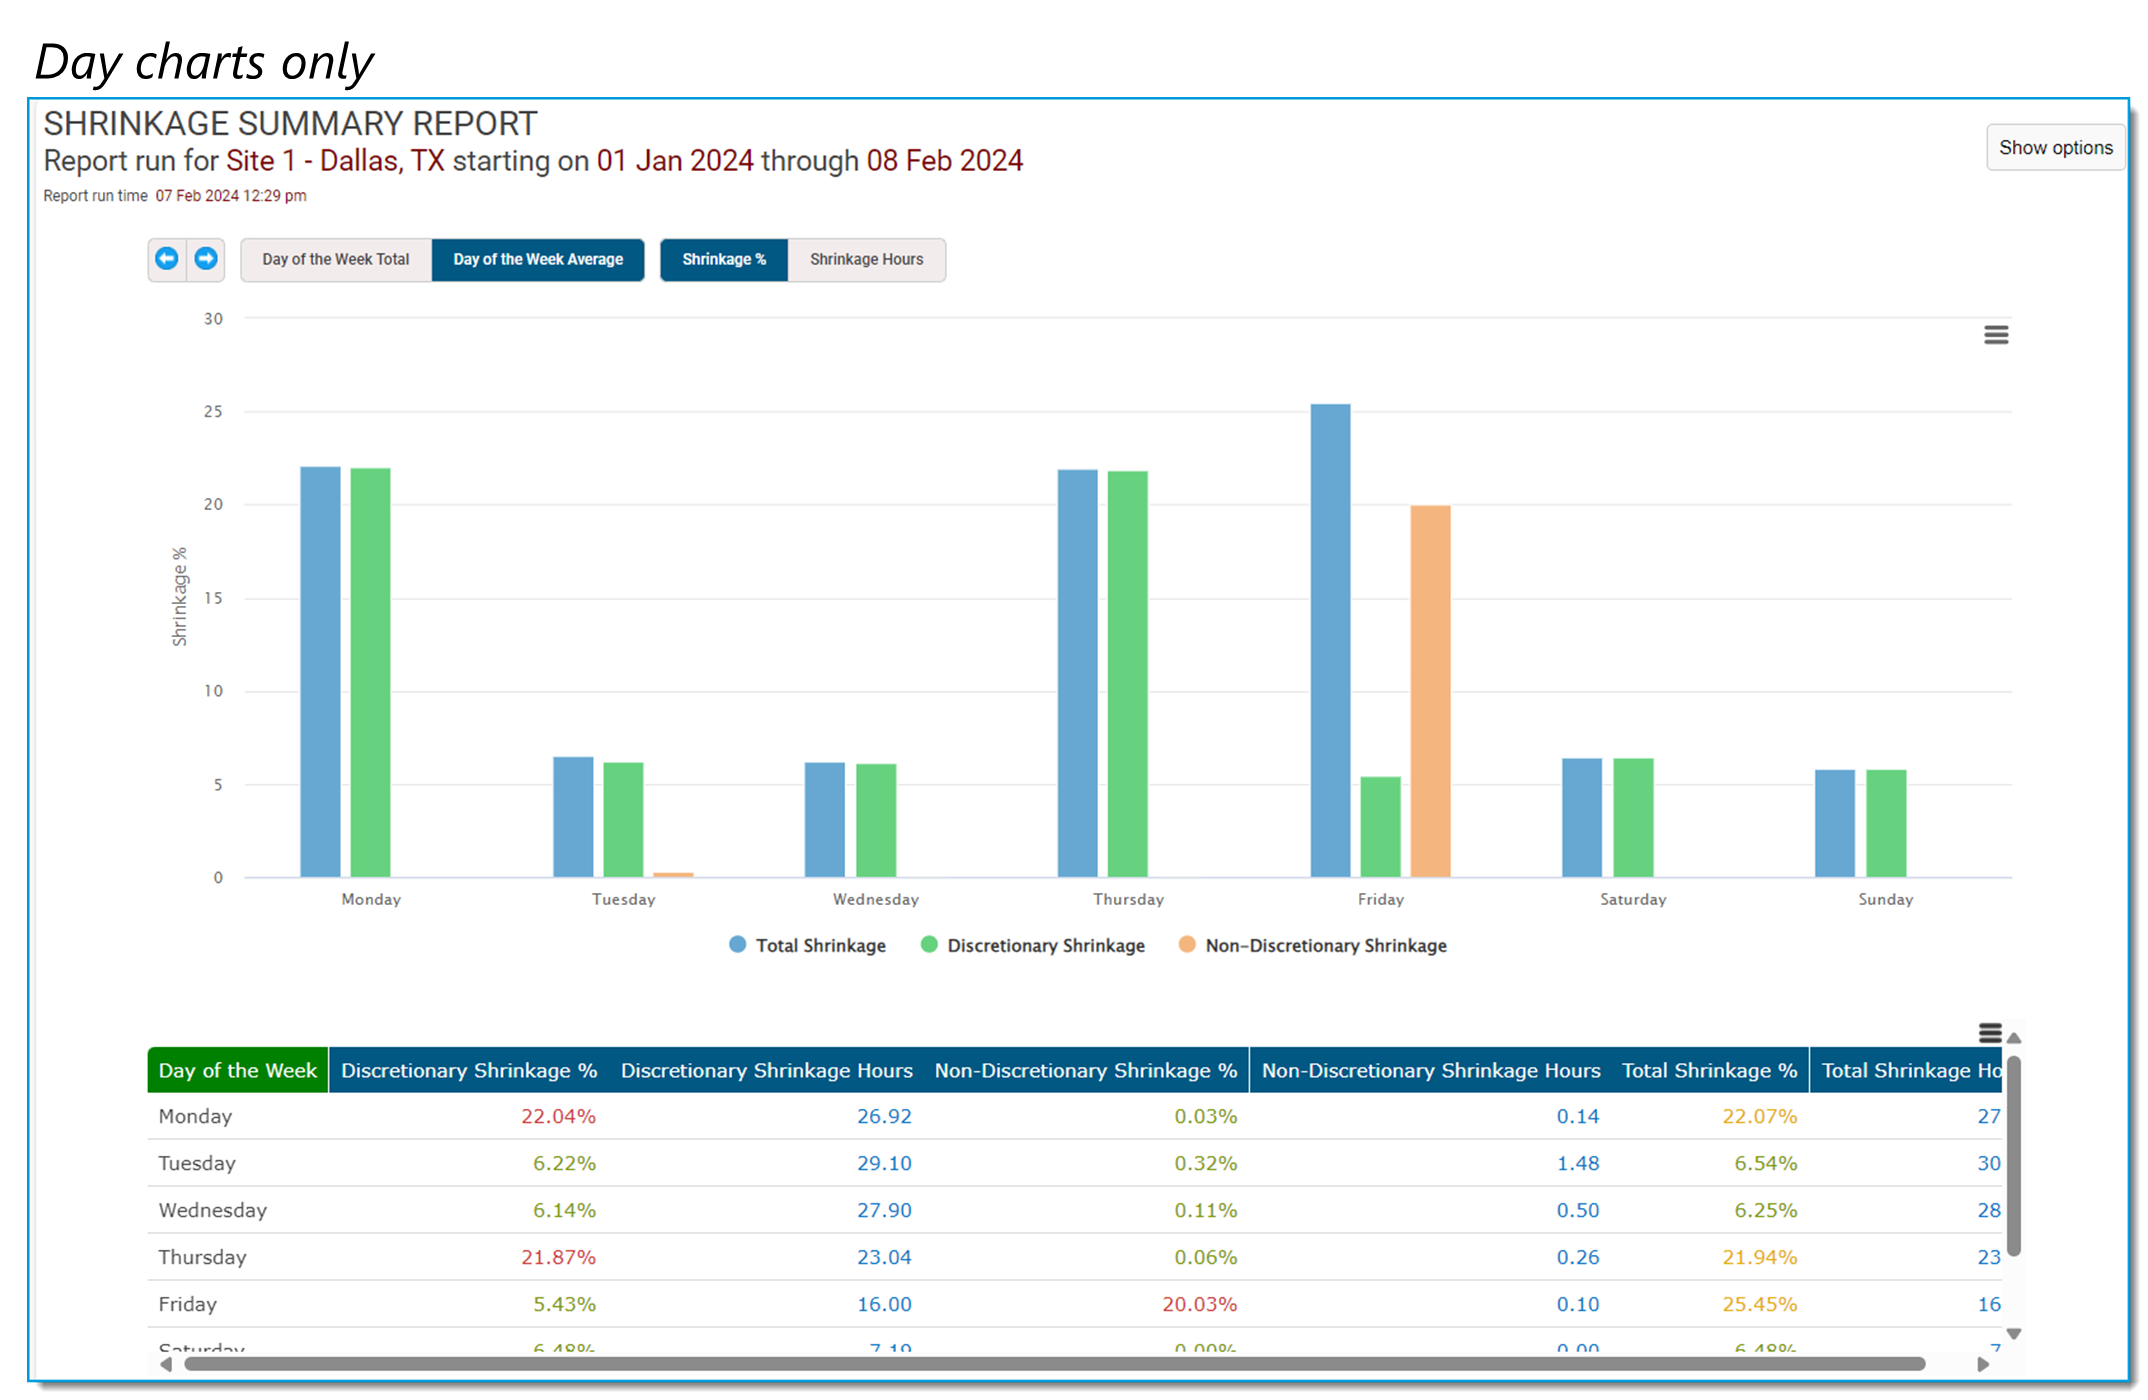
Shrinkage report
Use the published schedule shrinkage reports to analyze, forecast with, and report on discretionary and non-discretionary shrinkage. Shows a summary of shrinkage data for a selected date range. Options include date charts, interval charts, day charts, or day of the week charts, then use the filters to refine the report.
 Published event summary
The published event summary report includes a wealth of information and includes many filtering options. If selecting a date range of fewer than 90 days, details are available. When sorted for details, this is where you can approve, deny, revalidate, or remove time off requests. The Options panel allows filtering by date, event type, PTO classification, participant, or showing all.
Event type filters allow selecting specific events or restricting to PTO events.
You can further refine the report for only approved, denied, or pending events.
When viewing event details (Show event details filter), you can delete, approve, deny, or validate future time off requests in the report. You cannot delete or edit past events here.
Intraday analysis
These reports include the intraday performance monitor and schedule analytics. These reports let you know how your day is going, if your forecast is accurate, and whether you have the appropriate number of staff for the day.
Intraday performance monitor
The intraday performance monitor allows you to see the forecasted, actual, and projected staffing requirements. Run this report on a working forecast or a published forecast.
The top of the report includes a summary and graph with filtering options for contact volume AHT, staffing, and service. It shows today's past performance and projections for the remainder of the day and allows seeing the forecasted, actual, and projected staffing requirements.
Scroll down to the table to see each interval forecasted vs actuals, and the re-projected contacts, based on the actuals for the day.
Schedule analytics
Review key performance metrics from the published schedule including service estimate and staffing by current time, hourly, today, tomorrow, or this week.
Includes forecasted, projected, and observed (for today’s reports).
Schedule adherence
Monitor your agents’ adherence to their schedules. View daily, weekly, monthly, annual adherence. Agents also have their own adherence report available as a Today page module.
Each report may be run by Enterprise Model, Supervisor tree, or Custom user group.
Daily schedule adherence
This report includes everything from a published schedule, and you can quickly verify what agents are actually doing during a shift. Because this is a published schedule, you can make edits to the schedule within the report or create ASAPs using the drop-down menu at the top. It includes a graphical representation of the device state details as a third rail.
There are many options for this report in the Show options panel, including whether to suppress or include people with schedules for the day, and even whether to send notifications to agents when changes are made to the schedule.
Adherence alerts
Quickly view agents who are out of adherence (and for how long), and their current device state. You can even send the agent a message from within the report.
The panel on the right includes a summary of device states.
Schedule adherence history
A historical view of agents’ adherence to their schedules. Shows details by day, or subtotals by week, month, or any other date range.
This report includes the option to restrict to an individual agent’s name.
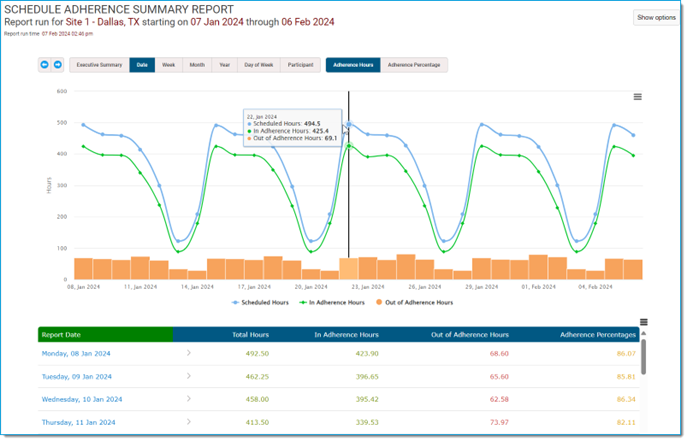
Schedule adherence summary
Another way of viewing schedule adherence history. This summary data has filters for executive summary and a variety of date ranges. View by individual agent or even by day of week to see patterns.
 Device state detail report
Shows all of the states each agent has been in on a given date. Can filter by employee classification, data source, or agent name.
Daily paid time
Shows total number of hours of paid and unpaid events for each agent. Can filter report by agent name and export is available at the agent level.
Schedule adherence comparison
Using the summary adherence data, the comparison report allows selecting up to five people or groups ("scopes") to compare schedule adherence for a specified date range. From an executive summary to individual details, see the top and low performers for each group, trends, in and out of adherence hours, etc.
Select individual agents to compare in a graph.
Administrative & utility
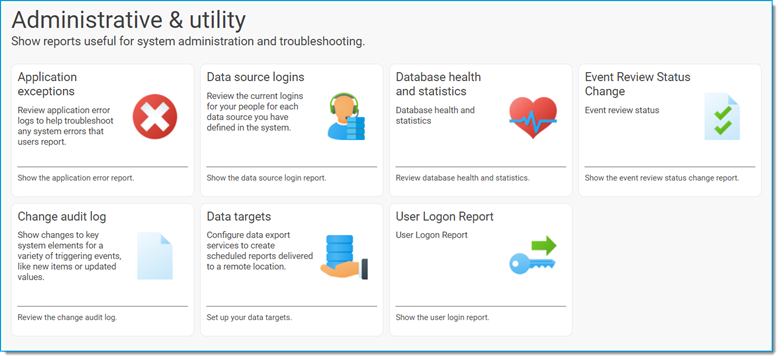 Application exceptions
This can be helpful when troubleshooting errors.
Data source logins
Quickly view agents without data source logins, those without a default data source, and the default data source for all agents. The table also includes the Employee ID, hire date, login ID, and assigned supervisor.
Database health and statistics
This report can be helpful when troubleshooting performance issues.
Additional options are available below the charts.
Database details
Includes options for server information, backup details, and object counts (useful for verifying the integrity of the database).
Database object reports
Includes options for table size, index size, index fragmentation, and command log.
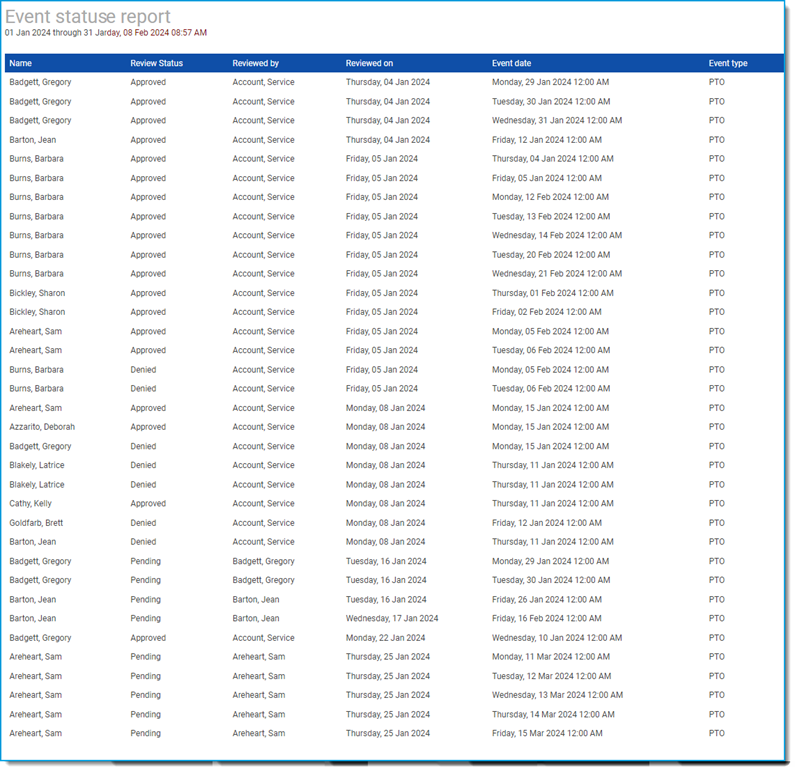
Event review status change
A list of event changes, such as approved and denied events. You can run the report by agent, supervisor, review status (approved, denied, pending), a single event type, or event classification. For example, see a list of all PTO requests and their status for a month.
 Change audit log
View changes made to the system, including the person who made the change.
Application
Includes changes to agent profiles, collection points, the Enterprise Model, and others.
Auto-Approve
Includes changes to the auto-approve rules for a specified date range. These apply to legacy and advanced vacation.
PTO Application
Includes changes to advanced vacation features such as PTO policies, calendar partitions, and accrual schedules.
Security
Includes changes made to security settings on any asset.
Data targets
Create, configure, and run data target reports (an optional feature).
User logon report
Includes people who are logged in to Community. Show only currently logged on users or all users, and sort by name, logon start time, or logon duration.
Reports in other places
Community includes many useful reports in other work areas.
Published Forecast Reports
Access these reports by navigating to Forecast > Published forecast then select Generate forecast reports in the Report tile.
Contact volume
Total Forecast Contacts by—
- Date
- Interval
- Day of Week
- Week
- Month
- Activity Type
- Media Type
Average Forecast Contacts by—
- Interval
- Day of Week
- Month
Service target
- Average Speed to Answer
- Deferred Service Level
- Service Level
Shrinkage percentages
- Date
- Interval
- Day of Week
- Week
- Forecast Month
- Month
- Activity Type
- Media Type
Staffing requirements
- Date
- Week
- Month (Total)
- Month (Average)
Forecast Contact Volume
Create your forecast with historical contact volume data and analyze your forecast accuracy. Use the Show options panel to change the chart type, then use the tabs to change the display.
Total Forecast Contacts by—
- Date
- Interval
- Day of Week
- Week
- Month
- Activity Type
- Media Type
Average Forecast Contacts by—
- Interval
- Day of Week
- Month
Forecast Staffing Requirements
This includes forecasted requirements based on contact volume, handle time, service target, and shrinkage.
Enter a date range to see historical data by:
- Date
- Week
- Month (Total)
- Month (Average)
Working schedule reports
Open a working schedule then use the navigation pane to select the report.
Interactive Schedule Reports
Includes agent by activity, weekly schedule by activity (useful if there are overnight shifts), schedules by supervisor or custom user group, and unassigned participant.
Unassigned participant report
View agents who do not have a schedule template assignment for the scheduled week. Use this report if, when running a schedule, you receive a warning message that there are agents without assignments.
Utility Schedule Reports
Participant availability and preferences
View approved schedule availability requests.
Effective schedule assignments
View a list of all agents, their schedule template type, or if they do not have an assigned template for the schedule week.
Assignment profile assignments
View a list of all agents and their schedule template assignment for the schedule week and who does not have a schedule template assigned.
Schedule generation results
View who generated the schedule, then expand to view the results of the schedule generation process for each agent.
Published Schedule Reports
Access these reports by opening any published schedule then expanding the sections in the navigation pane. You can select a different date range when running the report.
Interactive Schedule Reports
- Agent schedules by Activity
- Agent schedules by Supervisor
- Agent schedules by User Group
Schedule Analysis & Summary Reports
- Full Service Metric summary
- Compact Service Metric summary
- Schedule analysis
- Schedule analysis weekly view
- Schedule event summary
- Net staffing hours
- Daily paid time
- Weekly days off
- Published schedule shrinkage report
Printer-friendly Schedule Reports
- Schedule summary report
- Layered schedule summary
- Schedule detail by Date
- Schedule detail by Participant
Utility Schedule Reports
- Published schedule audit report
The published schedule audit report includes the option to unpublish existing schedules.
Daily published schedule report
In a published schedule: Interactive Schedule Reports > Agent schedules by activity. Select the report options then the report will open in a new window.
See all of your agent’s schedules for the selected day. Change the day in the drop-down menu. From here you can edit schedules, create automated schedule adjustment plans (ASAPs), and view staffing requirements by interval with projected service metric.
Time Off Report
Plan > All things time off > Time off reports. This report is the same as the published schedule event summary report but is restricted to events that occur off-site, are not in queue, and require supervisor approval. These options are preselected in the report options menu.
Includes executive summary down to the event details and multiple filter tabs allowing viewing by event status, event type, PTO classification, participant, then filter further by date, week, month, year, day of week.
This report includes estimated cost, based on the hourly wage included in the Enterprise Model.
All auto-approve business rules
Plan > Auto-approve service > Current rules report.
View all auto-approve time off rules for blackout dates, brownout dates, and minimum request intervals. There are tabs to view rules by activity or supervisor.
Device setup report
Settings > People & agent templates > Device setup report
A simple listing of each person and their notification channels — SMS devices, external email addresses, and push devices.
Cross-training and cluster report
Settings > People & agent templates > Cross-training analysis
Select a site, then review activity assignments (number of people assigned to each activity), people assignments (number of activities assigned to each agent), and cluster analysis. Click on the tiles to see details.
Customize forecast cluster information
In a working forecast in the Working Forecast Staffing Requirements section, select Customize forecast cluster information to access the Agent / Activity cross-training and reports.
The agent cross-training matrix returns a list of all agents and their activity assignments.
Where to find frequently requested reports
Where can I view a staffing requirements forecast?
There are three places where you can view a forecast for staffing requirements: in a working forecast, the published forecast, and the intraday performance monitor.
Where can I unpublish a schedule?
Schedule > Published schedule > expand Utility Schedule Reports in the navigation pane > select Published schedule audit report.
Where can I find a report of how my day is going?
Report > Intraday analysis > Intraday report monitor! Scroll down to see the day by 15-minute intervals, with projections for the rest of the day.
I need to review and approve/deny time off requests. Where is the best place?
Plan > All things time off > Time off reports then select Show event details tab. This report includes only time off events (occur off-site, not in queue, require supervisor approval) and is sorted in ascending event date order. The Created on column lets you know who made the request first for a given day.
I have people who want a printed copy of the schedule. Where is the best place to do this?
Schedule > Published schedule includes a section for Printer-friendly Schedule Reports. Schedule summary and schedule details options are available in Report > Published Schedule.
Agents have access to similar reports in Report > Published schedule.
Where can I see my shrinkage?
Report > Published schedule > Shrinkage report returns a shrinkage summary report. Select an activity, date range, then use the Chart display Options to view the data in different ways.
To view your forecasted shrinkage, navigate to Forecast > Published forecast > Generate forecast reports > Shrinkage percentages. This will include data only if you make changes to the shrinkage percentages section in a working forecast and then publish the forecast.